
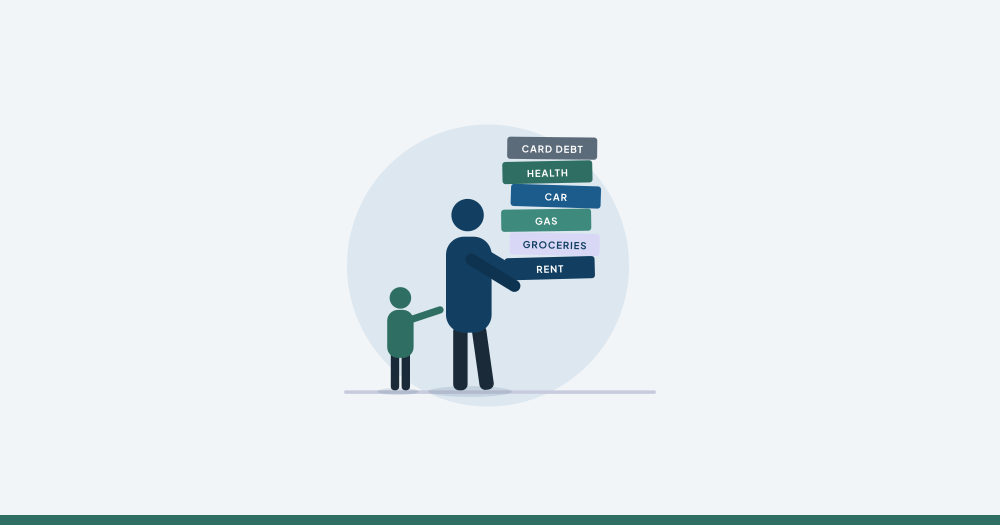
What Your People Are Carrying: Cost of Living, Pay and Raises
Key Takeaways
- Real pay fell this year. Weekly pay for full-time workers is down 1.6 percent after inflation, and private-sector wages and salaries are down 0.6 percent.
- The bills people can’t shop around for (rent, energy, car insurance and a first mortgage) have outrun inflation for a decade. Energy alone rose 20 percent in the past year.
- A median-income family that got the average raise saved about what it did last year. With a 2 percent raise, a blue-collar family’s savings fell by about a third.
- A dead car or an adjustable mortgage reset can wipe out a year of savings for a typical family.
- Your 2027 raise decision is the biggest number in your employees’ budgets that you control.
Thanksgiving is this week. Most of us will sit down with family and count our blessings. I will too.
Before you do, try one more count. Take your headcount and multiply it by two and a half. That is about the size of the average American household (BLS). A company of 40 people is really about 100 people. A company of 200 is about 500. Spouses. Kids. Aging parents your people help support. Most of them will never walk into your building. Every one of them feels your decisions.
They feel it in the size of the raise. In what the health plan costs at open enrollment. In whether the schedule lets someone make it to a school concert. In whether the paycheck stretches to the end of the month, or the credit card covers the rest.
I have worked with CEOs for more than thirty years. The ones I admire most carry that wider circle in their heads. They see the kitchen tables behind every line on the P&L.
This year, those tables are under more pressure than they were a year ago. You can’t fix the price of gas. You can make sure the people who depend on your company know you see them. That might be a fair raise. It might be holding the health premium steady. It might be a manager who asks the right question and listens to the answer.
Every fall I ask the CEOs in my groups the same question. How are your people doing? Not the business. The people.
Most owners answer with a number from their own payroll. Raises were 3.5%. Turnover is down. Nobody has complained.
Then someone tells the kind of story I hear every year. A foreman who picked up weekend work. A project manager who turned down a promotion because it meant moving. A bookkeeper who asked, quietly, whether she could be paid weekly instead of every two weeks.
Those stories are data too. The national averages say one thing. Your people are living something else. If you run a company of 20 or 200, you need to understand both, because the gap between them shows up in your turnover, your pay reviews and your hiring.
So I went back to the numbers. I compared September 2016 with September 2026, the latest full month, and adjusted everything for inflation. Then I checked what has changed in the last few weeks. Here is what your average employee is carrying into 2027, in plain terms.
The Good News Is Real
Start with the part nobody believes. The typical household is better off than it was ten years ago.
After inflation, median household income rose 10 to 13 percent from 2016 to 2025, to a record $87,460 (Census). That is the newest annual figure we have. Full-time weekly pay, also adjusted for inflation, rose about 6.6 percent from the third quarter of 2016 to the third quarter of this year (FRED/BLS). More families own homes. Fewer live in poverty. Fewer go without health insurance.
Debt is not the crisis the headlines suggest either. Yes, household debt sets records. It does that most years, because the economy grows. The better question is how much of each paycheck goes to debt payments. That share is a little lower today than it was in 2016 (FRED/Federal Reserve).
So if someone in your leadership meeting says everyone is worse off than ten years ago, the numbers say no. But that is not the end of the story. It is the beginning.
Where the Money Goes Now
Inflation is an average. Nobody lives on an average.
Overall prices rose about 40 percent over the past ten years (BLS). Some things rose far less than that. Groceries, cars, clothing and medical care all got cheaper once you take inflation out. That surprises people, and I understand why. Everyone remembers the grocery shock of 2022. Prices did jump. Over the full decade, though, they ended slightly behind inflation.
The trouble is in the bills people can’t shop around. After inflation, rent rose about 8 percent faster than prices overall. Car insurance rose 23 percent faster. Energy rose 25 percent faster, most of it this year.
And buying a first home is in a category of its own. In September 2016, a median-priced home with 20 percent down carried a principal-and-interest payment of about $841 a month. That was about 17 percent of median household income. Today the same purchase, at this week’s 7.28 percent mortgage rate (Freddie Mac), runs about $2,280 a month. That is roughly 31 percent of median income. After inflation, the payment has nearly doubled.
Buyers have noticed. Home sales in October fell to their slowest pace in 16 years. First-time buyers made up just 29 percent of sales, against a historical norm of about 40 percent (NAR).
Here is what that means for your people. The things they can cut back on got cheaper. The things they can’t cut back on got more expensive. That is why the good averages feel wrong to them. Bank of America’s research team reached the same conclusion this month: housing is the main exception, and the pressure reaches well up the income ladder. About one in four higher-income households with a mortgage spends more than half its income on housing (Bank of America Institute).
2026: The Year the Trend Broke
From 2023 into early this year, paychecks were catching up with prices. That stopped this spring. An oil shock tied to the conflict with Iran pushed energy prices up 20 percent in a year, and overall inflation reached 3.7 percent in September (BLS).
Pay did not keep up. Over the year to September, private-sector wages and salaries fell 0.6 percent after inflation, according to the Labor Department (BLS). Real weekly pay for full-time workers is down 1.6 percent from a year ago (FRED/BLS). Households are filling the gap by saving less. The saving rate fell to 3.8 percent in September (FRED/BEA).
There is some relief at the pump. The national average for gas fell below $4 on November 12 for the first time since July, though it is still the most expensive November on record (AAA). AAA put it at $3.78 this week (El Cronista, citing AAA), compared with about $3.07 a year ago (AAA).
Mortgage rates are moving the other way. They rose to 7.28 percent this week, from 6.26 percent a year ago (Freddie Mac).
Think about what this looks like at the kitchen table. Your employee got a 3 percent raise in January. By summer, the gas tank, the electric bill and the car insurance had eaten it. Nobody cut their pay. It just feels that way. Consumer sentiment hit a record low of 44.8 in May (Trading Economics). It has recovered only partway since, to 51.0 in the University of Michigan’s preliminary November reading (ABA Banking Journal). That November figure is preliminary and may change as final data comes in. Either way, people are not imagining it.
How Much Did the Cost of Living Rise for a Typical Family in 2026?
National numbers are hard to picture. So let me put them in a kitchen. Here are two households built from government averages: one blue-collar, one white-collar. Both earn close to the national median household income. I set each one up in November 2025 saving about 5 percent of take-home pay, close to where the national saving rate stood last fall (FRED/BEA). Then I moved every bill by what it actually did over the past year.
Mike and Lisa rent a two-bedroom apartment and have one child in school. Mike runs a machine at a manufacturer, full time, at $29.33 an hour, the average for production workers in manufacturing last October. Lisa works 15 hours a week at $31.70, the private-sector average for non-supervisory workers (BLS). Together they earned about $85,700 before taxes. Mike drives about 70 gallons’ worth a month between the plant and family errands.
| Mike and Lisa, monthly | Nov. 2025 | Nov. 2026 | Change | Nov. 2026 if the car dies |
| Take-home pay (with the average raise) | $5,858 | $6,071 | +$213 | $6,071 |
| Rent | $1,500 | $1,542 | +$42 | $1,542 |
| Groceries | $750 | $764 | +$14 | $764 |
| Eating out | $200 | $207 | +$7 | $207 |
| Gasoline (70 gallons) | $215 | $267 | +$52 | $267 |
| Electric and heat | $200 | $209 | +$9 | $209 |
| Car insurance | $200 | $202 | +$2 | $202 |
| Car payment (loan taken out before Dec. 2025) | $550 | $550 | $0 | $582 (used car, today’s average loan) |
| Family health premium, their share | $571 | $623 | +$52 | $623 |
| Credit card interest | $125 | $130 | +$5 | $130 |
| Everything else | $1,249 | $1,281 | +$32 | $1,281 |
| Total spending | $5,560 | $5,775 | +$215 | $5,807 |
| Left to save | $298 | $296 | −$2 | $264 |
| Memo: credit card balance owed (not a monthly bill) | $6,700 | $6,980 | +$280 | $6,980 |
Dana is a project manager at an engineering firm, earning $44.90 an hour, the average in professional and business services (BLS). That is about $93,400 a year. Her husband stays home with their young daughter. They bought a house in 2021 and locked in a mortgage under 3 percent. She drives less than Mike, about 50 gallons a month.
| Dana’s family, monthly | Nov. 2025 | Nov. 2026 | Change | Nov. 2026 if the car dies |
| Take-home pay (with the average raise) | $6,070 | $6,253 | +$183 | $6,253 |
| Mortgage, principal and interest (fixed, 2021 loan) | $1,164 | $1,164 | $0 | $1,164 |
| Homeowners insurance | $246 | $255 | +$9 | $255 |
| Groceries | $850 | $865 | +$15 | $865 |
| Eating out | $400 | $414 | +$14 | $414 |
| Gasoline (50 gallons) | $154 | $191 | +$37 | $191 |
| Electric and heat | $250 | $261 | +$11 | $261 |
| Car insurance | $220 | $222 | +$2 | $222 |
| Car payment (loan taken out before Dec. 2025) | $650 | $650 | $0 | $787 (new car, today’s average loan) |
| Family health premium, her share | $571 | $623 | +$52 | $623 |
| Credit card interest | $125 | $130 | +$5 | $130 |
| Everything else | $1,131 | $1,161 | +$30 | $1,161 |
| Total spending | $5,761 | $5,936 | +$175 | $6,073 |
| Left to save | $309 | $317 | +$8 | $180 |
| Memo: credit card balance owed (not a monthly bill) | $6,700 | $6,980 | +$280 | $6,980 |
Two things jump out. First, the same year hit these families differently. Mike and Lisa’s costs rose 3.9 percent. Dana’s rose 3.0 percent. The renter who drives to the plant felt it more than the homeowner with a 2021 mortgage. Fixed payments made the difference. Dana’s mortgage and both car loans did not move a dollar. Gas and health coverage did most of the damage in both houses. Gasoline went from about $3.07 a gallon to $3.81 (Money Talks News, citing AAA), and the worker’s share of a family health plan rose 9 percent in one year (KFF).
Second, both families stayed about even only because they got the average raise for their field. Change that one number and the picture changes fast.
| The raise they got this year | Mike and Lisa save per year | Dana’s family saves per year |
| Last year, for comparison | $3,576 (5.1% of take-home) | $3,708 (5.1%) |
| The average raise for their field | $3,552 (4.9%) | $3,804 (5.1%) |
| A 2% raise | $2,400 (3.3%) | $3,060 (4.1%) |
| No raise | $996 (1.4%) | $1,608 (2.2%) |
Look at the bottom two rows. If your company froze pay or gave 2 percent this year, that is your people. And notice what is not in either budget. There is no line for a family vacation. Nothing is set aside for the kids’ activities: travel sports, dance or music lessons, summer camp, the weekend tournament two states away. For many families, those are the things that make the hard work feel worth it. In these numbers, every one of them has to come out of that thin savings line or go on the card.
Now add one more thing. The car dies. The mortgage and car payments in both tables come from loans taken out before December 2025, so I have not adjusted them for today’s rates. That stability disappears the day the transmission goes. A replacement car means a new loan at today’s prices. The average used-car payment is now $582 a month at 10.6 percent, and the average new-car payment is a record $787 at 7 percent (Edmunds). Look at the last column in each table. Mike and Lisa’s savings drop to $264 a month. Dana’s family falls to $180, about $2,200 a year.
And that is before the down payment. The average new-car buyer put about $6,000 down last year (Edmunds). With the new payment, that is more than two and a half years of what Dana’s family can save. One broken transmission, and the savings plan is gone.
One more what-if. Suppose Dana’s family had taken a 5/1 adjustable-rate mortgage in 2021 instead of a fixed one. The rate stays put for five years, then resets every year. That reset is happening now. The new rate is a benchmark called SOFR plus a lender margin, usually 2.25 to 2.75 percent (TD Economics). SOFR sits near 3.9 percent today (FRED), which points to a rate around 6.6 percent. Most of these loans cap the first jump at 2 points and later jumps at 1 point a year (Clever, citing the CFPB).
| If Dana’s mortgage were a 2021 ARM | Rate | Monthly payment | Change | Left to save each month |
| Before the reset | 2.96% | $1,164 | — | $317 |
| First reset (2-point cap) | 4.96% | $1,436 | +$272 | $45 |
| Second year (1 more point) | 5.96% | $1,578 | +$414 | −$97 |
| No first-year cap | 6.625% | $1,684 | +$520 | −$203 |
In the first year after the reset, her family’s savings fall from about $3,800 to about $540. In the second year, they spend about $1,200 more than they bring home. If the car dies the same year, they are short from the first month.
This is not most of your people. About 148,000 ARMs will reset in 2026 and another 186,000 in 2027 (HousingWire, citing ICE). But an employee facing one knows it is coming, and you won’t unless you ask. A jump of $272 to $520 a month is bigger than most raises.
All of this lands on households with less cushion than they had a year ago. That falling saving rate is the cushion getting thinner. And it was thin to begin with. In the Federal Reserve’s latest survey, only 63 percent of adults said they could cover a surprise $400 expense with cash or its equivalent. Twelve percent said they could not pay it at all (Federal Reserve). Fewer than half of Americans, 47 percent, have the money to cover a $1,000 emergency (Bankrate). Both surveys were taken in late 2025, before the saving rate dropped this spring. The picture today is probably worse.
Put that next to Mike and Lisa. They save $296 a month. A $1,000 brake-and-tire job wipes out more than three months of it. A $3,000 transmission wipes out ten. When the cushion is that thin, the shock goes on the credit card at 22 percent, and the balance in that memo line keeps climbing.
I gave both families a $6,700 card balance, about the national average per borrower (TransUnion), and grew it the way the country’s did: up 4.2 percent, to about $6,980. That is the memo line at the bottom of each table. The interest row moves with it, from $125 to $130 a month. Nationally, card balances hit a record $1.285 trillion this fall, up about $52 billion from a year earlier (New York Fed). The average rate on cards that charge interest is 22.36 percent (LendingTree, citing Federal Reserve data). For Mike and Lisa, that is about $1,560 a year in interest, more than 40 percent of what they save even with the average raise. And 5 percent of all household debt is now in some stage of delinquency, up from 4.7 percent just one quarter earlier (New York Fed).
Here is the point for owners. Your raise decision is the single biggest number in this picture. Prices you can’t control. Raises you can.
Which Employees Are Feeling the Squeeze Most?
Averages hide the spread. In the companies I work with, four groups feel this most.
Your youngest employees. Families headed by someone under 35 saw their median net worth fall 23 percent from 2022 to 2025, to $33,000 (CBS News). Most of them rent. Many want to buy. The math is working against them, and they know it.
Your lower-wage employees. In 2025, income at the 90th percentile rose 1.7 percent. The bottom tenth saw no meaningful gain (Axios). Gas, utilities and rent take a bigger share of a smaller check. And the cushion is thin well beyond the bottom: a Pew survey found 52 percent of middle-income adults lack emergency savings to cover three months of expenses (eMarketer, citing Pew).
Anyone working for a small company. That is most of the people reading this. KFF’s 2026 employer survey found that workers at firms with fewer than 200 employees pay an average of $9,687 a year toward family health coverage. That is $2,847 more than workers at larger firms pay (KFF). Your people feel that every payday, whether or not they say so.
Anyone you ask to move. A homeowner with a 3 percent mortgage who relocates for a job trades it for a 7 percent mortgage. That is hundreds of dollars a month. Expect good candidates to hesitate over that one number.
What Should Employers Do About Rising Costs?
You can’t fix oil prices or mortgage rates. You can make sure your people aren’t carrying more than they have to, and that they know you see it. Here is where I would start.
- Learn your own numbers. National averages are a starting point. Your workforce is not average. Do this: Take your three most common roles. For each, write down the take-home pay, a typical local rent and what the employee pays for family health coverage. If rent and health coverage eat more than half of take-home pay, you have a retention problem whether you see it yet or not.
- Price 2027 raises against 2026 reality. Real pay is down this year. A raise that looked fair in January may feel like a cut by June. Do this: Build your raise pool against this year’s inflation, not last year’s budget. Then explain the number to your team in plain language. People can accept a hard number. They resent a silent one.
- Treat health coverage as part of the paycheck. The average worker now pays $7,471 a year toward family coverage, up 9 percent in one year (KFF). Do this: Know what your people pay and how it compares. If you can hold the employee share steady next year, do it, and tell them you did.
- Check the cost of getting to work. Car insurance and repairs have outrun inflation for a decade. AAA puts the cost of owning a new vehicle at $12,863 a year (AAA). Do this: Review mileage rates, vehicle allowances and fuel policies for field and commuting staff. Many were set years ago and never touched.
- Rethink how you recruit across markets. Relocation now carries a real price tag. Do this: Budget for relocation help or remote options on hard-to-fill roles. When you recruit, talk about total cost of living, not just salary.
- Ask, and listen. Most employees will not raise money problems with the boss. Do this: This quarter, have every manager ask one question in a one-on-one: “What is the biggest money pressure at home right now?” Listen for the things coming at them that you can’t see, like an adjustable mortgage about to reset or a car on its last legs. Don’t try to fix it in the meeting. Collect the answers. Look for patterns. Then act on the two or three that show up most.
Back to the Table
I started with the question I ask every fall. How are your people doing?
You now have a better way to answer it. Not with your raise budget or your turnover rate. With a picture of their month. Mike and Lisa, who got the average raise and watched higher bills eat all of it. Dana, whose fixed mortgage is a big reason her family stayed ahead. The foreman picking up weekend work. The bookkeeper asking to be paid weekly. Stories like those are not complaints. They are signals.
In more than thirty years in rooms with CEOs, I have learned that people rarely tell the boss money is tight. They tell you in other ways. A request for more overtime. A quiet question about pay timing. A good employee who suddenly takes a recruiter’s call. By the time it shows up in your turnover numbers, the decision was made months earlier, at a kitchen table you never saw.
Success here is simple to describe. Your people can cover the basics on what you pay them. They understand why you made the pay and benefit choices you made. And they hear about changes from you first, not from the rumor mill.
Watch two numbers over the next six months: oil prices and unemployment. If oil keeps easing, 2026 will look like a spike. If unemployment starts climbing, the cushion your people have relied on gets thinner fast. Either way, the number that matters most is the one you control. It is the raise you set in the next few weeks, and how you explain it.
You don’t need a better economic forecast than anyone else. Nobody has one. You need to know what your own people are carrying, and act before they decide to carry it somewhere else.
So take a minute this week. Walk the floor before the holiday. Thank people by name. Then, when you sit down at your own table on Thursday, remember the math from the start of this piece. Forty employees, a hundred people. Two hundred employees, five hundred people. Every one of them will be at a table too. Every one of them is counting on the choices you make next.
That is the privilege of leadership. It is also the responsibility.
The economy runs on averages. Your company runs on people.
Frequently Asked Questions
How much should I raise salaries for 2027? Start with this year’s inflation, not last year’s budget. Prices rose 3.7 percent in the year to September (BLS). Private-sector wages and salaries rose 3.1 percent, which left them down 0.6 percent after inflation (BLS). A raise at or below 3 percent will likely feel like a cut. Whatever number you choose, explain it in plain language.
Why do employees feel worse off when the averages say they are better off? Over ten years, household income grew faster than prices. But the costs people can’t cut, like rent, energy, car insurance and buying a home, grew faster still. Then in 2026, pay fell behind prices for the first time in three years. People feel the bills, not the averages.
How much do workers pay for family health coverage in 2026? The average worker pays $7,471 a year toward family coverage, up 9 percent in one year. At firms with fewer than 200 employees, the average is $9,687 (KFF).
How many Americans can cover an emergency expense? In the Federal Reserve’s latest survey, 63 percent of adults could cover a surprise $400 expense with cash or its equivalent (Federal Reserve). Only 47 percent could cover $1,000 (Bankrate). Both surveys were taken before the saving rate fell to 3.8 percent in September.
What can employers do about the rising cost of living? Learn what your most common roles actually take home and pay out. Price raises against this year’s inflation. Hold the employee share of health premiums steady if you can. Review mileage and vehicle policies. Budget for relocation on hard-to-fill roles. And have managers ask each employee what money pressure they are facing at home.
How I built this: Ten-year comparisons use September 2016 and September 2026 government data, adjusted for inflation with the Consumer Price Index (prices rose 39.6% over that period). Household income, poverty and health coverage are published once a year, so those compare 2016 with 2025. Home payments are my calculation: a 30-year fixed loan on 80% of the national median existing-home price, principal and interest only. Prepared with AI-assisted research. Check any number against its source before relying on it for a decision.
How I built these examples: Wages are BLS averages for October 2025 and October 2026. Taxes are a flat estimate (18 percent of gross for Mike and Lisa, 22 percent for Dana), held the same both years. Starting bills are typical amounts, not survey figures. Each bill then moves by its actual change: September-to-September consumer price index changes for rent, groceries, restaurants and utilities; Insurify’s 1 percent rise in full-coverage premiums for car insurance (the government’s car insurance index fell 5 percent over the year to September but turned up in October, and Insurify’s number is closer to what families see at renewal); AAA pump prices for gas; KFF for health premiums; Insurify for homeowners insurance; Federal Reserve data for card rates. “Everything else” (phone, clothing, school costs, household goods) is set so each family starts at a 5.1 percent saving rate, and it rises with core inflation, 2.6 percent. Mortgage and car payments are fixed loans taken out before December 2025 and are not adjusted for current interest rates. The “if the car dies” column swaps in today’s average payment for a financed used car (Mike and Lisa) or new car (Dana), from Edmunds’ third-quarter 2026 data. The ARM example uses Dana’s same 2021 loan ($277,520 at 2.96 percent, about $246,500 still owed after five years), re-amortized over the remaining 25 years at each new rate, with a 2.75 percent margin over a 3.92 percent 30-day SOFR average. Real families vary. The direction is what matters.
Ed Robinson is the founder of Capacity Building Solutions, Inc. and a Vistage Master Chair. capacity-building.com · (240) 426-4457 · robin_ed@capacity-building.com